What it is
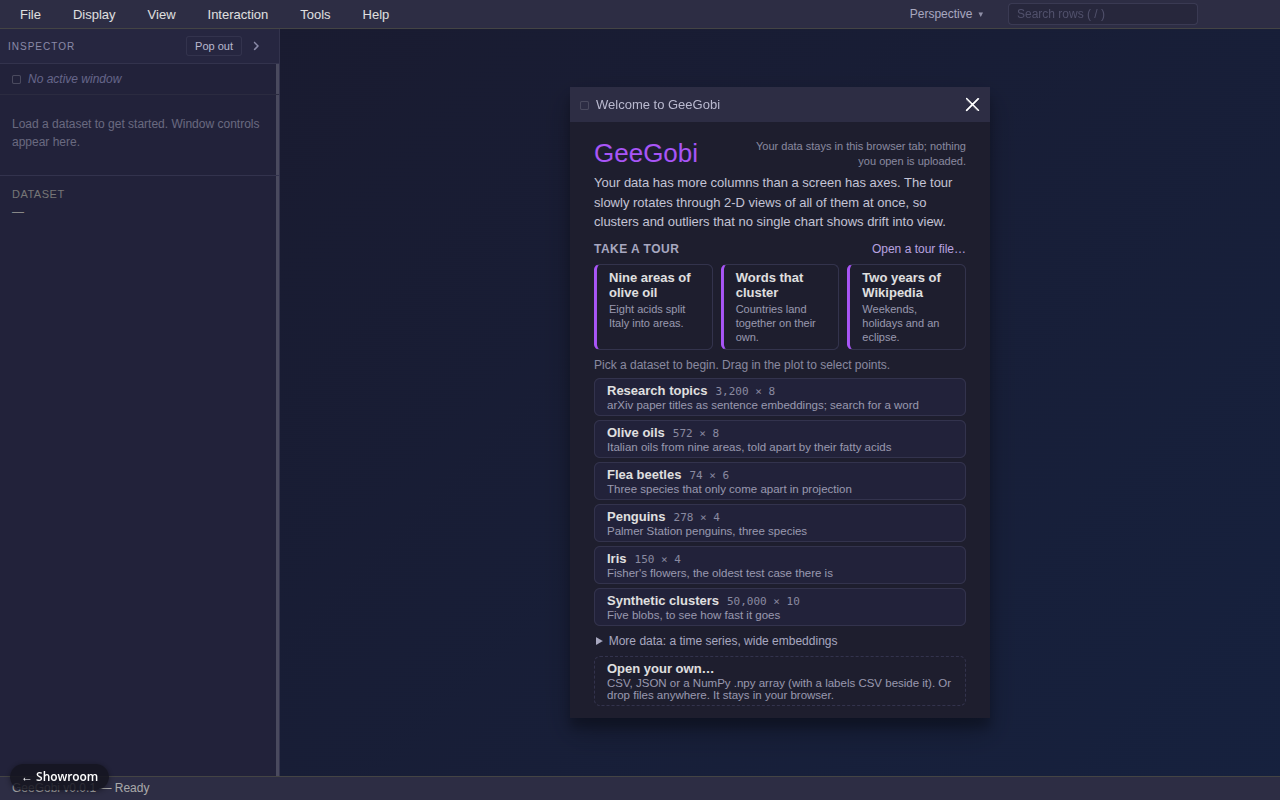
GeeGobi brings back a classic idea from statistics software: the "grand tour." When a dataset has many columns, no single chart shows its shape. GeeGobi smoothly rotates the data through a stream of 2D views, like turning a sculpture in your hands, so clusters and outliers pop out. Every chart is linked: select points in one and they light up in all the others. It is a modern browser rebuild of GGobi, an old research tool.
Try it
Start from the welcome window: click the "Nine areas of olive oil" tour card, or pick the Olive oils or Penguins dataset. A table and a tour window open, and the tour hunts for the view that pulls the groups apart ("Wander" switches to free rotation). Drag across some points to select them and watch the same rows highlight in the table. Add a parallel-coordinates or bar-chart window from the Display menu and select again. Press T to tile the windows. You can also drop in your own CSV; it never leaves your browser. A desktop with a mouse works best. The datasets are real public data, except one synthetic set built to test speed.
How it works
- Open the app and pick a dataset, or drop in a CSV or JSON file.
- The grand tour starts, gliding between random 2D views of all the columns.
- Press "Find structure" to run a guided tour that searches for the most revealing view.
- Or drag variables in and out of the view by hand.
- Brush points in any window; the same rows highlight everywhere. Search highlights matching rows too.
What exists today
- Grand tour and guided tour with several "interestingness" measures, checked against the reference R package to 15 decimal places
- Scatterplot, parallel coordinates, bar chart and table windows, all linked
- Fast drawing for up to about 50,000 points
- Import wizard, drag and drop, tiled windows, legends and tooltips
- Six built-in datasets and sample saved tours
- Newest layer: a tour file format, an authoring page, and a connector so an AI agent can drive and describe tours
- About 1,500 unit tests and over 500 browser tests
What isn't there yet
- Early version; not published as a package
- The AI tour-authoring layer is the least settled part
- The full browser test run is slow, which slows releases
- The licence for the newest version is being reconsidered
Under the hood
- TypeScript monorepo with separate packages for the core math, renderers and extras
- Canvas 2D and WebGL2 renderers
- Smooth rotations use geodesic interpolation between views
- Built as a static site that works from any web address