What it is
PProp is a civic data prototype. It takes public election results and asks a simple question: where are the most registered voters who did not vote? It scores each voting precinct by how many people skipped the election and how low turnout was, adds Census demographics, and shows the result on a dark map. The idea was to help volunteer groups decide where outreach would matter most. It was built in a two-day session.
Try it
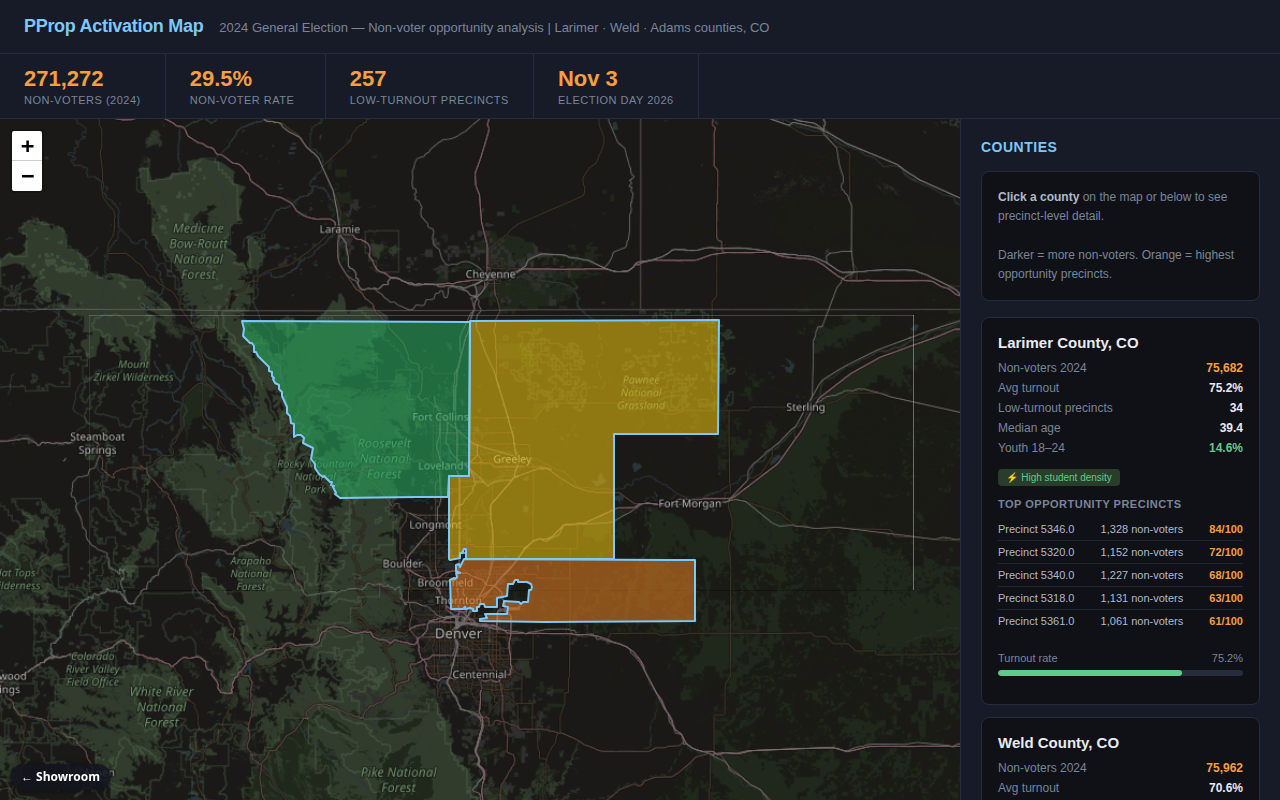
The page opens on a map of three Colorado counties shaded by non-voter rate, with headline numbers across the top. Hover a county to see its non-voters, turnout and share of 18-24 year olds. Click a county, on the map or in the list on the right, to zoom to it; each county card shows its turnout, median age, youth share and its five top-scoring precincts. Everything comes from real public data: the state's 2024 precinct turnout file and Census survey numbers. The map shows counties only; precincts appear in the cards, not as shapes. Desktop is easiest.
How it works
- A script reads the state's official 2024 precinct turnout spreadsheet.
- It computes turnout and an "opportunity" score for each precinct.
- Another script joins county Census data: median age, income, share of young adults, share of college graduates.
- A third script writes the map shapes and a summary file.
- The web page draws the counties colored by non-voter rate, with stat cards and a precinct list.
What exists today
- The data pipeline from raw turnout files to scored precincts
- The Census join at county level
- A one-page web map with hover tooltips, summary cards and county details
- Precincts ranked by opportunity score (the page shows the top five in each county)
- Headline result: about 271,000 registered voters in the three counties did not vote in 2024 (about 30 percent)
What isn't there yet
- Precinct boundaries are not on the map; that needs county shapefiles
- Demographics are by county, not by precinct
- Planned pieces (a writing helper for outreach scripts, a newsletter, voter-list tools) exist only as written requirements
- Covers three counties and one election only
- The timing was aimed at the 2026 midterms, so it would need a new target
Under the hood
- Python with pandas for the pipeline
- A single HTML page with Leaflet and a dark basemap
- All inputs are public government files; no personal voter records are used
- Output is a small GeoJSON map file plus summary JSON, so it hosts as static files