What it is
FlavorGraph is a playground built on a published research dataset that links about 6,600 ingredients to each other and to their flavor compounds. Type an ingredient and you see its best partners three ways: what cooks often use it with, what shares its chemistry, and what a learned model places nearby. It can also suggest "surprise" pairings that are chemically close but rarely cooked together, and suggest additions for a recipe.
Try it
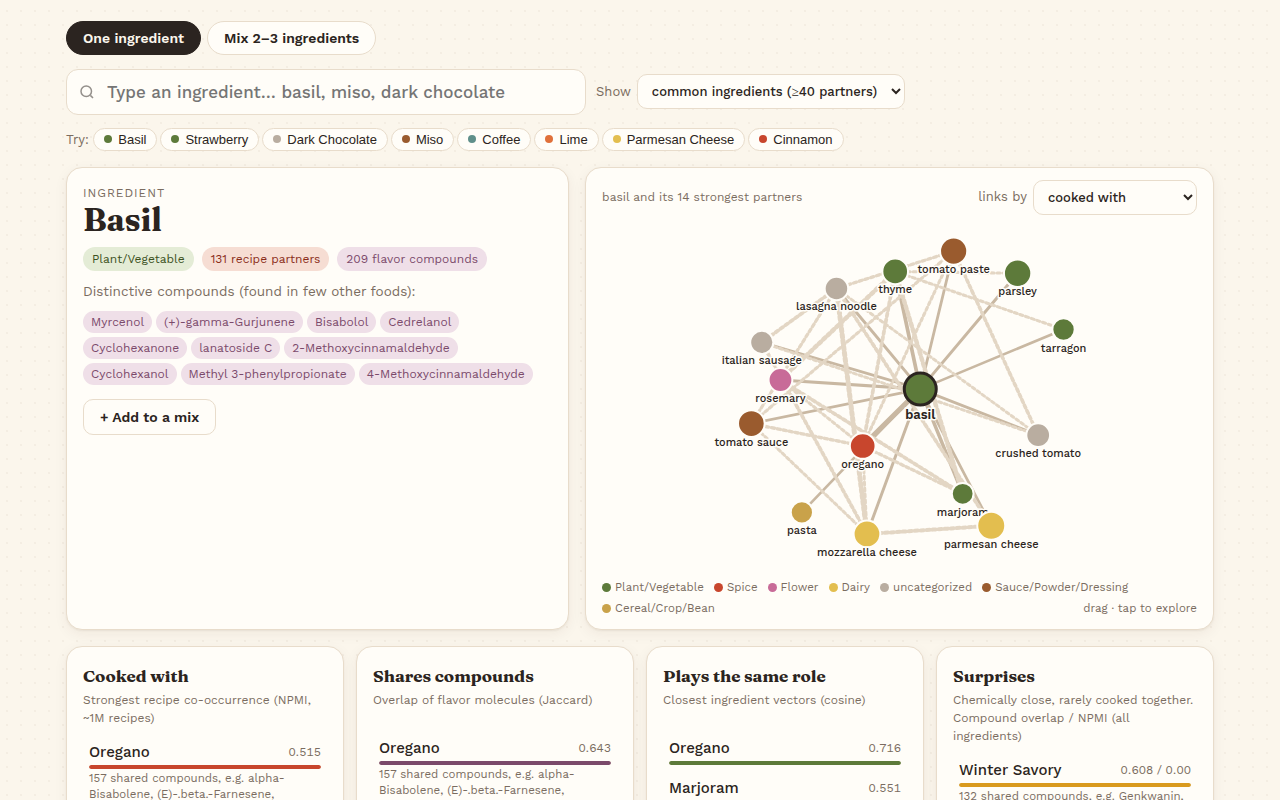
Pick one of the "Try" chips (basil, miso, dark chocolate) or type an ingredient. You get its four lists: what it is cooked with, what shares its flavor compounds, what plays the same role, and surprises (chemically close, rarely cooked together). Tap any row for a head-to-head comparison of the two ingredients. The network graph beside the lists shows the strongest partners. Then try "Mix 2-3 ingredients" to get suggestions for what to add to a combination. Everything is computed in your browser from the real published dataset (credited on the page) and works on a phone. Shared chemistry hints at a match but doesn't promise one tastes good.
How it works
- Type an ingredient, or paste a recipe line like "2 cloves garlic, minced" and it finds the matching ingredient.
- See neighbors by three signals: how often they appear together in recipes, how many flavor compounds they share, and closeness in a learned embedding.
- Ask for surprise pairings: high chemistry, low real-world use.
- Compare any two ingredients on every signal.
- Feed in a recipe export to get suggested additions near the recipe's flavor center.
What exists today
- A command-line tool with neighbors, surprise, pair, match, recipes and train commands
- Three similarity signals side by side
- Our own embeddings, trainable in about two minutes on a laptop
- A filter that hides rare ingredients
- A recipe report, tested on one small sample recipe
What isn't there yet
- A 2D map of the whole ingredient space is planned, not built (the demo's network graph shows one ingredient's neighbors)
- Pantry mode and substitution lookup are planned
- Recipe import has only been tried on one short recipe
- Chemistry data covers about 400 well-studied ingredients, not all of them
- The official published embeddings were not downloaded, so it uses our own
Under the hood
- Python package with graph, embedding and command-line modules
- Data from the FlavorGraph research project (open source, Apache 2.0), credited
- Pairing strength is measured with a standard co-occurrence score (NPMI)
- Embeddings come from random walks over the ingredient-compound graph
- The showroom page is a JavaScript version that computes every list in the browser from the published graph